A Definitive Ranking of NZ Council GIS Viewers
see end for updates
New Zealand is blessed with a lack of unification. A while ago it was decided that we should be split into regions, then districts. Regional and district councils are an important part of our local government, representing the inhabitants in each region, mostly with diverse groups of white men. But do not fear, no matter where in the country you are, you will have representation through taxation thanks to your friendly regional GIS viewer.
And these GIS viewers are important. The layperson can log in and make use of a friendly UI to find out property boundaries, gas lines, government valuations, flood risk and so on. And, far less importantly, my first introduction to GIS was through Auckland Council’s GeoMaps.
Creating this list was challenging. I will be using both regional and district councils. Lots of district councils like to get ahead of themselves and act as regional councils - there are a fair few of what I can only assume are redundant ESRI contracts. Why do we have so many GIS viewers? I seek not to answer this question, but to celebrate the diversity we have the only way I know how: reading far too much into bad user interfaces and employment of open-source software.
Let’s begin. Using the dreadfully outdated council maps on the Local Government NZ website I tracked down each regional council and attempted to find its corresponding GIS viewer. I managed to find a GIS viewer for each region, save for Nelson and Tasman who kindly share. How does one evaluate such a complex and vital piece of digital infrastructure? Arbitrarily and with no mercy. All jokes aside, I am sure that each region is functioning well with their GISystems, so if I insult your locality please take my judgement with a tone of sarcasm - and please, hire me.
Testing Conditions
Browser: Google Chrome 89.0.4389.72 64-bit
Operating System: Debian 10
Window Manager: i3
Browser Window Resolution: 1200 x 900
Reviewing
I will summarise every GIS viewer from North to South. I will rank each viewer on a scale from 0 to 10, the former being a buggy viewer that does not load anything correctly, the latter being a piece of GIS art. Of course this is entirely arbitrary - the last time I will remind you of this, but it needs to be said.
I will follow up with a conclusion where I give my thoughts on GIS viewers as a whole, and how I feel about the regional system in the context of geospatial resources.
Summary
| Council | Viewer Name and Link | Based on... | Notes |
|---|---|---|---|
| Northland | NRC Local Maps | LocalMaps (ESRI) | Each map opens a unique session relating to chosen dataset |
| Auckland | GeoMaps | ArcGIS Dashboard (ESRI) | Cool mesh of data. Take a look at traffic cameras |
| Waikato | Property Viewer | IntraMaps 9 (TechnologyOne) | Link is ‘Property’ collection. Look at Waikato LASS Data Portal (ArcGIS-based) for more |
| Bay of Plenty | Bay eXplorer | GeoCortex (built on ArcGIS) | More maps outside of BayeXplorer, but BayeXplorer is best |
| Taranaki | Taranaki LocalMaps | LocalMaps (ESRI) | |
| Gisborne | Tairāwhiti Maps | GeoCortex (built on ArcGIS) | |
| Hawke’s Bay | Maps & GIS | LocalMaps (ESRI) | Other links show purpose-build maps, some of which are pretty good - see this Hazard Portal |
| Wellington | GW Mapping | Pretty sure it’s LocalMaps (ESRI). Modified a fair bit | Linked is the really nice homepage, they also have an ArcGIS data hosting site |
| Nelson & Tasman | Top of the South Maps | ArcGIS Dashboard (ESRI) | I like how they joined forces for this one, very cute. I wonder if they had to fight over whose name was displayed on the header first |
| Marlborough | Smart Maps | LocalMaps (ESRI) | |
| West Coast | WestMaps | LocalMaps (ESRI) | |
| Canterbury | Canterbury Maps Viewer | ArcGIS Dashboard (ESRI) | A product of a bunch of district councils. Also includes a basic ‘3D’ viewer (DEM with satellite imagery I suspect) |
| Otago | Otago Maps | LocalMaps (ESRI) | They try and rebrand LocalMaps a bit. I wonder if they paid extra just to get their own splashscreen |
| Southland | Southland District Maps | Hexagon Geospatial (Intergraph) | Uses leaflet which is cool. Barely works which isn’t |
Te Ika-a-Māui (North Island)
NRC Local Maps (Northland Regional Council)
Northland is right up the top of Te Ika-a-Māui, and with a local economy based mostly on agriculture and horticulture, I expected a good interface with an abundance of VHR aerial imagery for spying on your neighbour’s crops. NRC Local Maps (remember Local Maps, we will see it again) loads you up into a browser of layers as opposed to a GIS viewer per se. There are only 16 maps on display, and I suspect they are phasing into a new version of their GIS as some maps open one interface and some another.
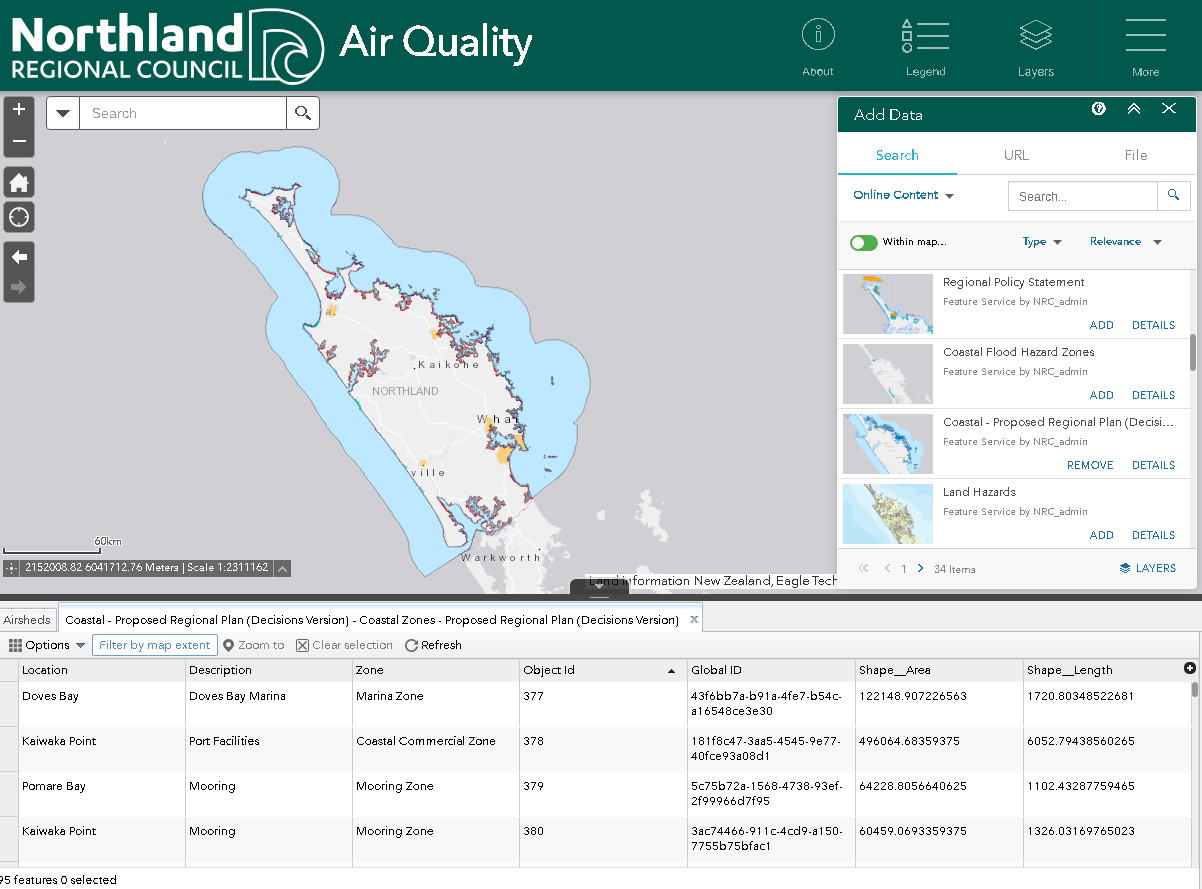
Tools like draw and select are here, but barely. The user interface has this strangely annoying fade effect which makes it frustrating to navigate. You can export features with options for file types which I approve of. Basemaps are that of a standard ESRI account (no orthorectification). Panning is laggy but certainly usable, as with zooming. You can add layers from URL and/or file which is cool to see. I suppose I can see the merit in having a dedicated viewer for each layer for those who are used to paper maps, but it just isn’t very effective in my view.
Overall, 4/10 seems right to me. Let down by a clunky UI and poor data management system, this viewer does have some nice features underneath.
Auckland Council
Please ignore any JAFA pretentiousness you may sense in my writing, I assure you I will be impartial. That aside, take my word when I say that GeoMaps is really cool. The interface is snappy, you can access a smorgasbord of data (orthorectified 10cm aerials anyone?), and can perform all of the basic spatial analysis tools that one would expect.
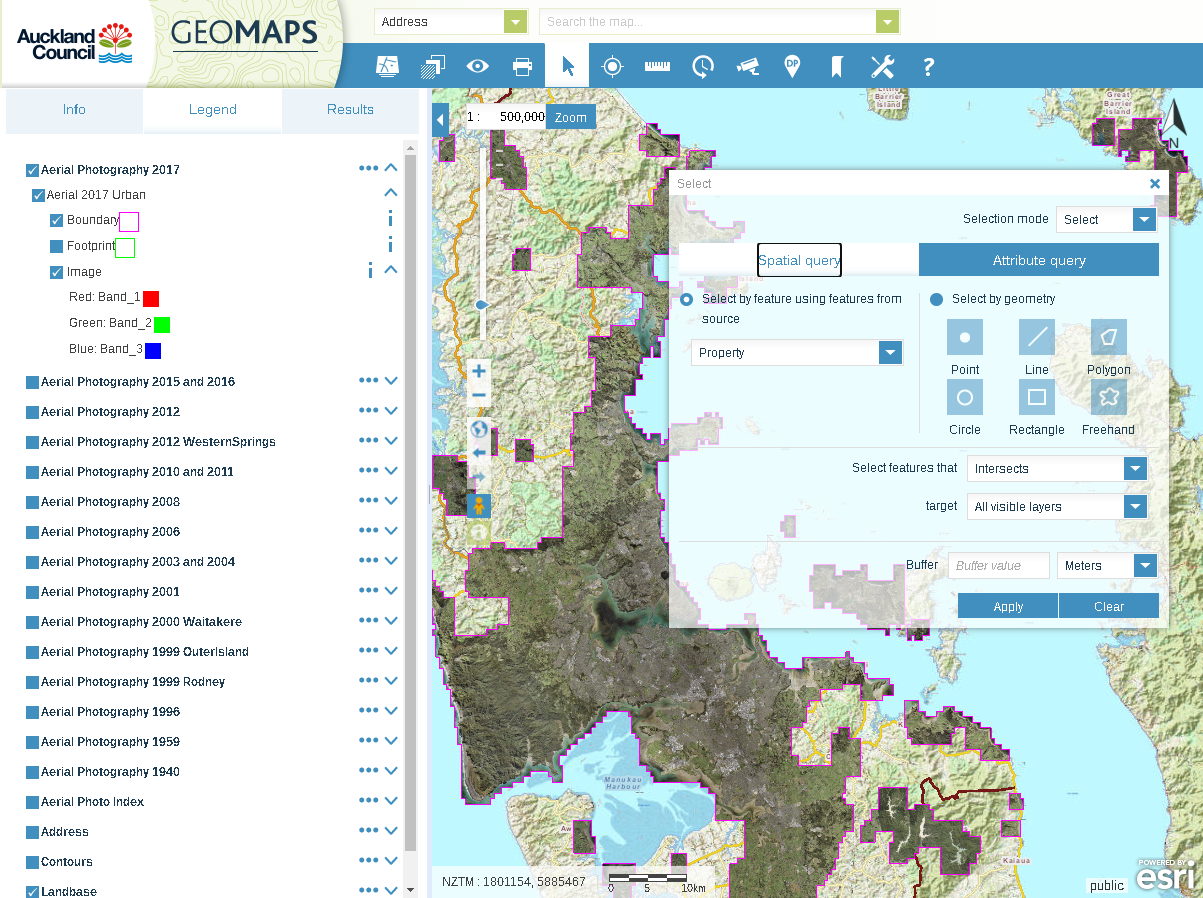
The viewer goes above and beyond with easy-to-access supplementary data like traffic cameras, a time slider for the group of layers you are looking at, clipping and exporting into several formats (would have liked to see more projections if I had to be picky). Importantly, the help button loads the user in to a really cool set of guides. These guides are great for those less accustomed to GIS, and I think this is part of what really sets GeoMaps apart from most of the others. This viewer appears to be designed for ‘professionals’ and the everyday person (more than likely a property investor frothing at the mouth looking at their capital gains) which I think is great. For all of this, GeoMaps gets a healthy 9/10.
Waikato District Council
Now for Waikato. The UI is a bit retro, but usable. ‘Modules’ split up the datasets, which is actually a decent way of going about it. The location dropdown is cool, including a search tool for road intersections which is interesting.
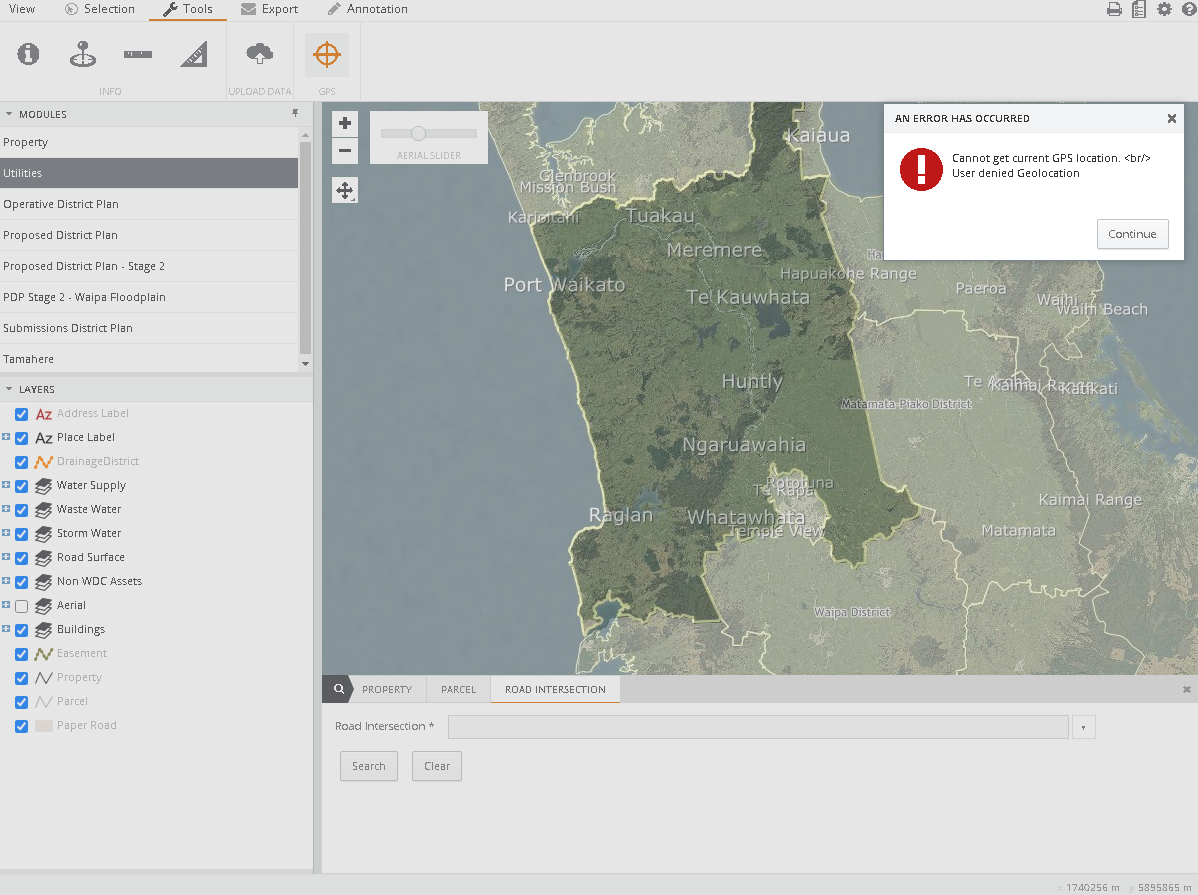
Honestly, there is not much to say about this one. It is not particularly interesting and does not stand out in any way. There is a small selection of what I can only assume is useful data, but there are quite a few random bugs and CSS spacing errors that make it a bit of a chore to get to. Basic analysis tools are appreciated, but overall I think an overhaul of functionality is needed. For that, they get 4/10. Also, take a look at that filthy <br> tag syntax error they left in the error message on my screenshot.
Bay of Plenty Regional Council
The page that loads up on the Bay of Plenty GIS site is slick and informative. They have a lot of links to various mapping tools. I chose to evaluate the BayeXplorer as, while it is designed for ‘consultants and other professionals’ (their words), it is an inclusive ‘dashboard’ rather than their individual map browsers. And I’m rather fond of it. The UI is basic but effective, basic tools are all there, even a nifty little static map printer.
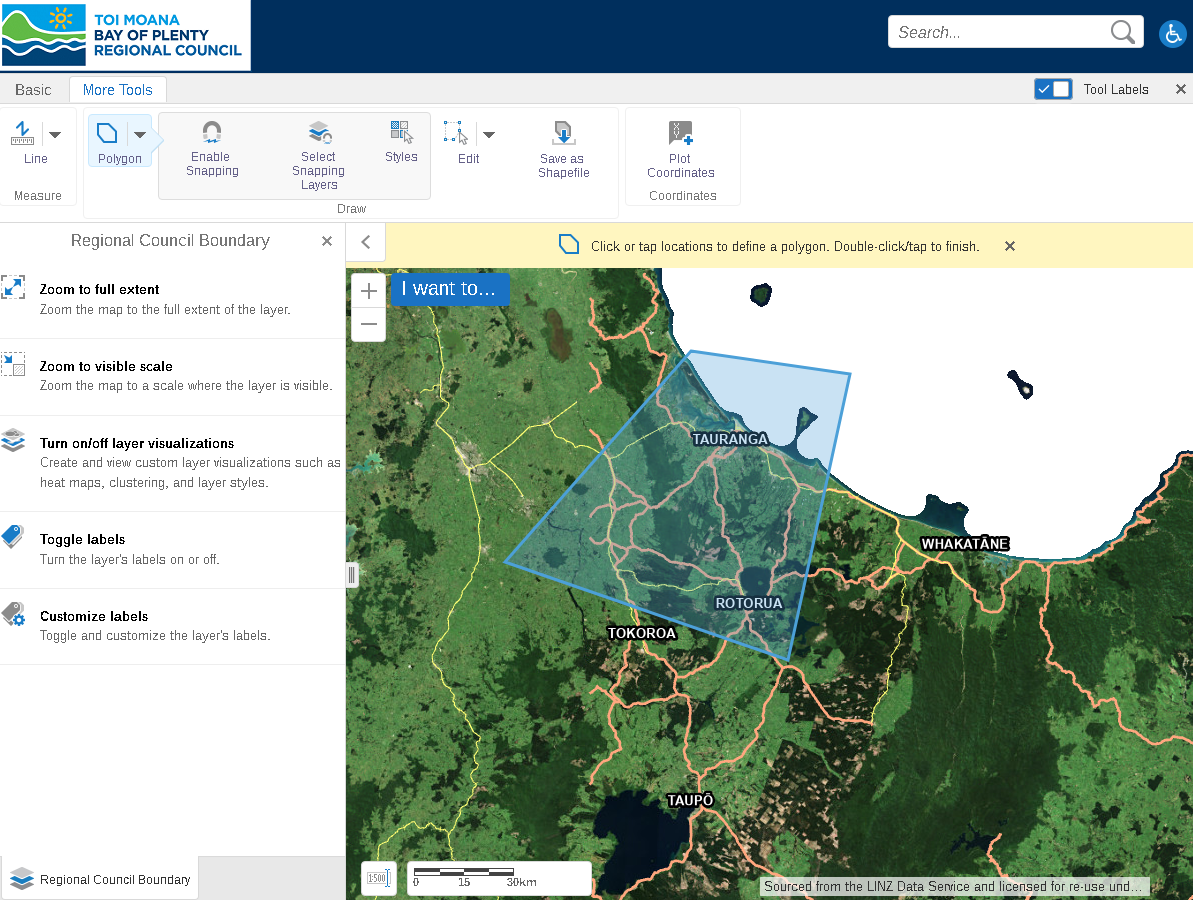
The data available directly is not expansive, but probably all that 90% of users will require. You can also upload your own data to the map. Overall, BayeXplorer gets a 6/10, and I would be lying if I didn’t say they missed out on an 7 because of that god awful casing of the BayeXplorer name.
Taranaki Regional Council
Taranaki Civil Defence Emergency Management were in the news during last year’s lockdown thanks to their sweet GIS tool that gave info about what businesses and facilities were open. This made me think the Taranaki region is some kind of GIS paradise, but I knew I was mistaken when a familiar LocalMaps gallery greeted me. Their UI is faster than that of Northland, so they have that going for them off the bat.
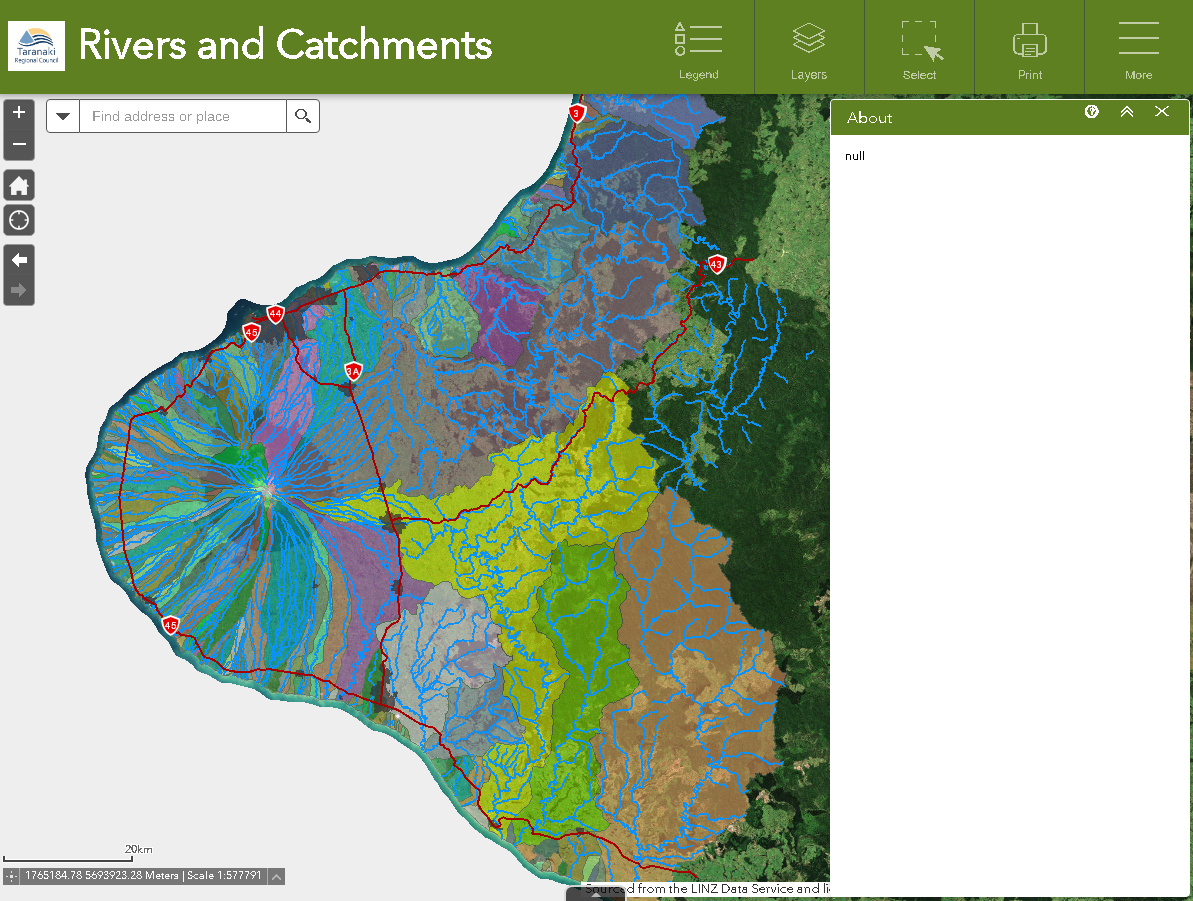
And honestly, LocalMaps worked decently here. The data they have is really cool (I recommend taking a look at the Resource Consents map), and specific enough to almost warrant having isolated map instances. Cool data, cool presentation, probably a cool GIS team, let down a bit by the LocalMaps gallery system. They would get a 7, but their About section reads ‘null’, which is pretty bad (and rather funny). 6.5/10
Gisborne District Council
Tairāwhiti Maps is interesting. Using GeoCortex, the same as BayeXplorer, all the basics are here. Some extra links to other maps, as well as more effectively organized tools are in its favour.
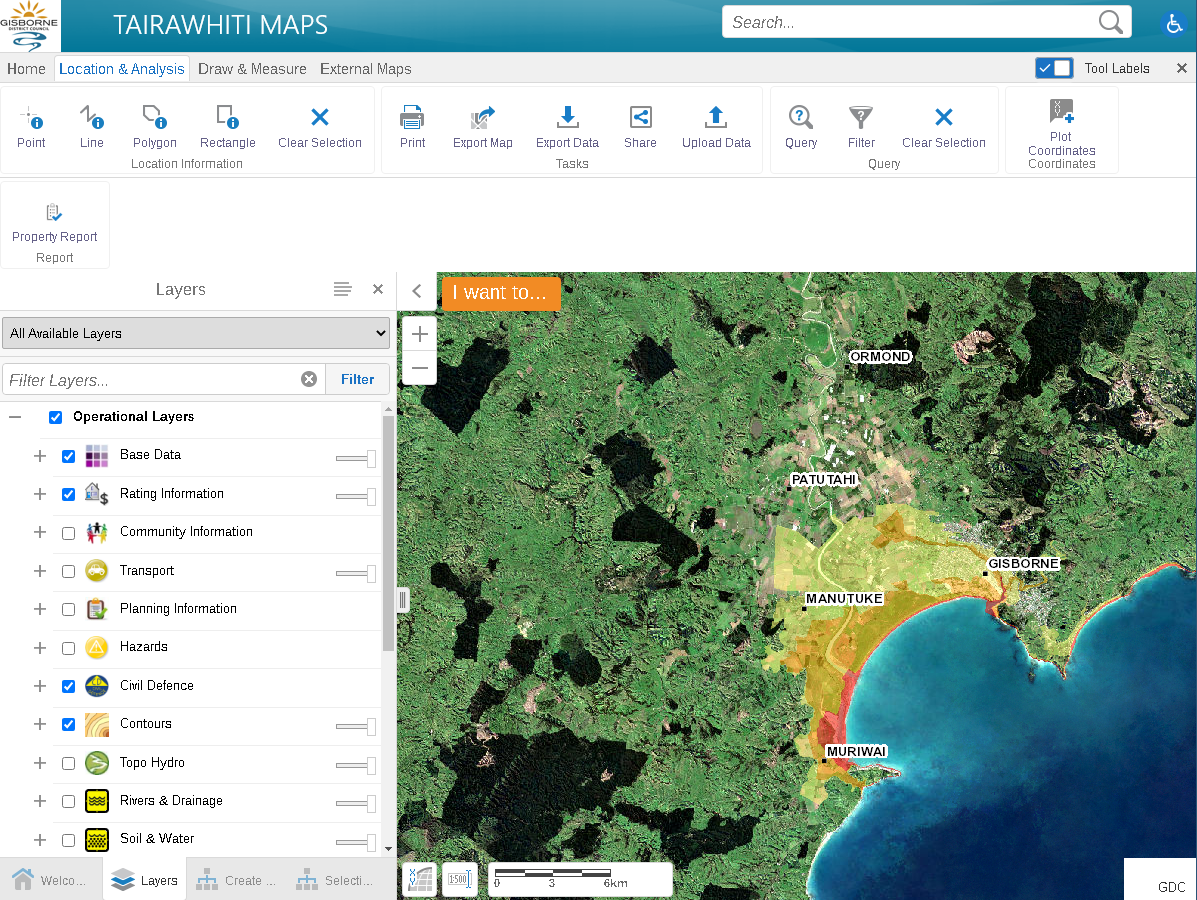
These links to other maps are what make it interesting. Opening these external maps will launch an entirely different GISystem (ArcGIS Dashboard) which seems redundant. Why have two systems? Probably the result of some ratepayer/bureaucratic feud, but it seems unnecessarily confusing to me so they get a 5/10. Also, good lord, the url 'gizzy'.maps.. needs to be changed.
Hawke’s Bay Regional Council
The Hawke’s Bay Regional Council website is really nice. Looks great, loads quickly, has lots of information. Once you do load up this information, you get a LocalMaps UI with the same lacklustre multi-layer functionality as all LocalMaps systems.
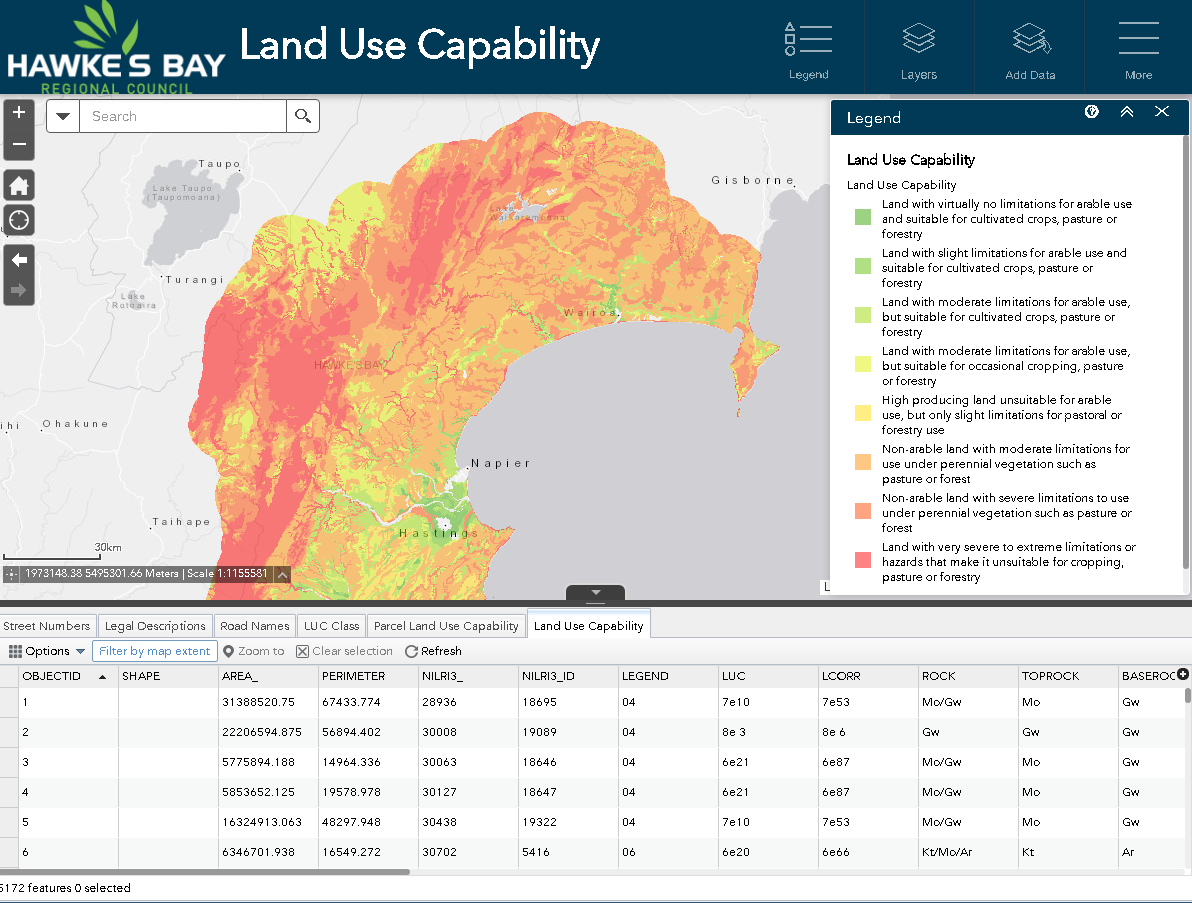
They have cool data, but not a lot of it. It is a small region so I understand this, but it still results in a less enjoyable GIS viewer experience. 5/10.
Greater Wellington Regional Council
You might be put off by the sheer number of links on the GW Mapping Services site when you first load it up. Take some time to catch your breath, as there is method to its madness. Lots of information is here, as well as links to affiliated organisation. At first, I hated it, now I love it.
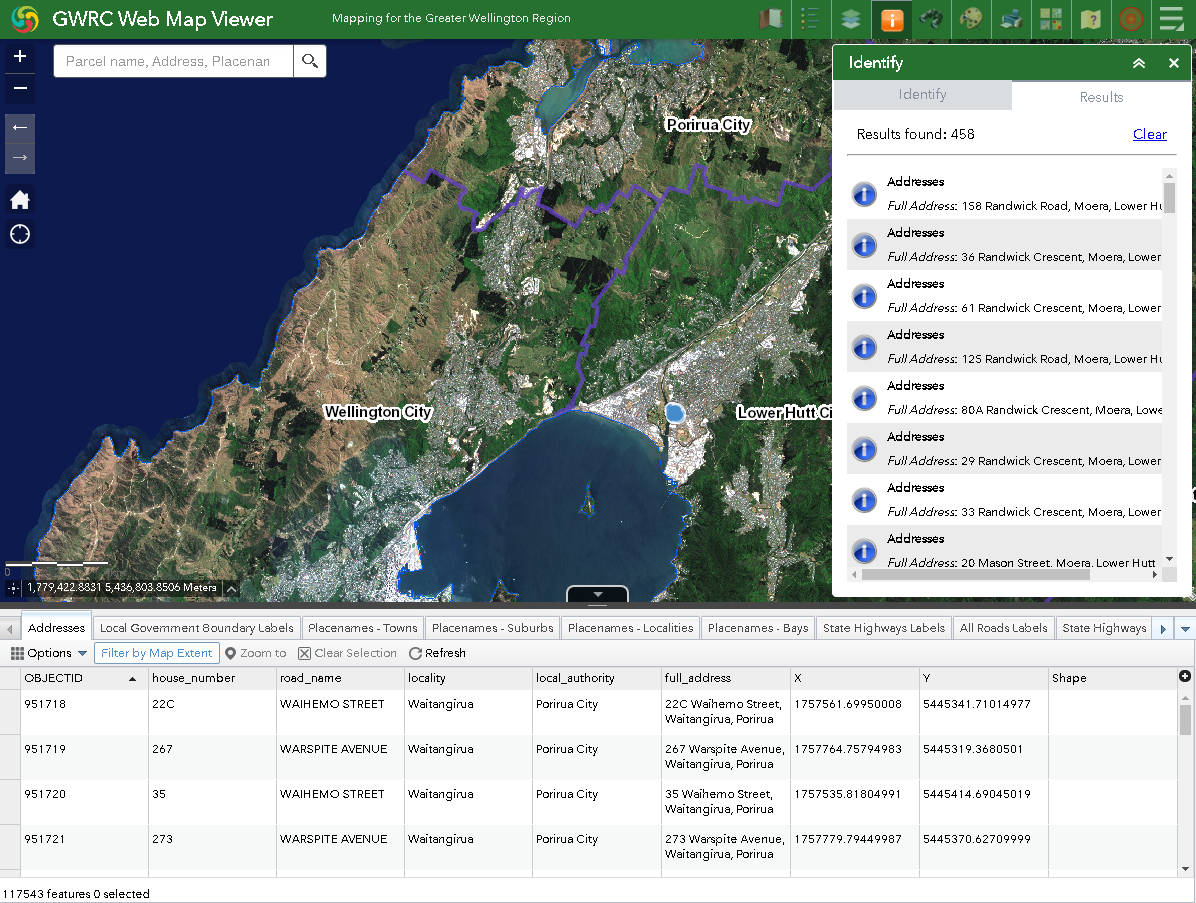
Loading up the map viewer, we get some nice imagery and a clutter-free UI. A problem that even GeoMaps has is that the map frame is often cluttered with tools and attribute tables by default. Wellington focuses on the map itself, which I love. The fade effect of LocalMaps still really pisses me off, but the other shortfalls of LocalMaps are handled well by GWRC. The data available is good, but does not match the depth of GeoMaps, for example. I’m going to go with 8/10.
Te Waipounamu (South Island)
Nelson City Council/Tasman District Council
I know it’s a bit cheesy, but I really like the name: Top of the South Maps. What I like even more is the choice to combine forces into a single GIS viewer. A really good idea for such small districts. The UI is good. Starting off with a nice basemap, we can expand context menus to get tools and data. On data, there is very little of it. What is there is cool, like nice aerials, layers for services, planning, hazards etc.
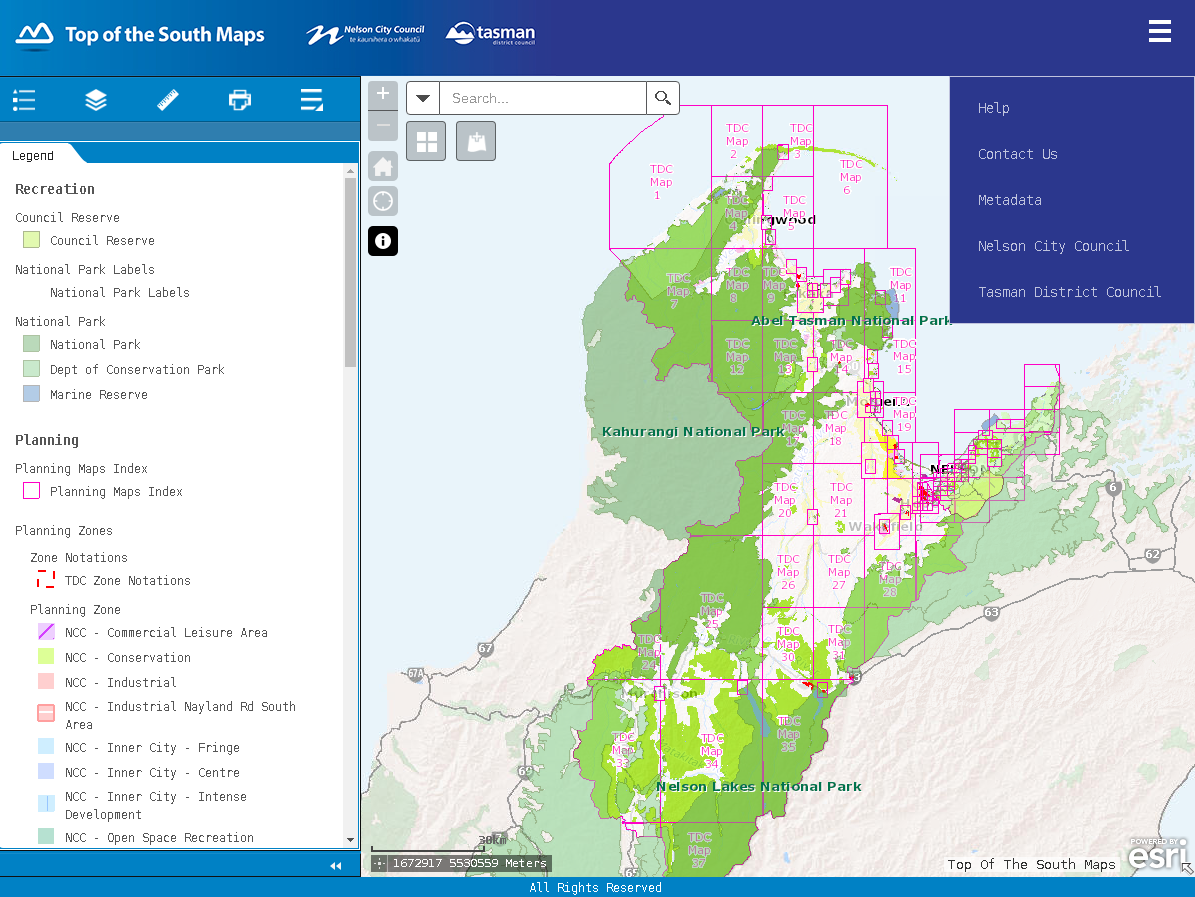
For their size, Nelson and Tasman are punching above their weight. The lack of data is obvious, but what is there is everything most users will need and is accessible with a great UI. They felt the need to gender the Google Street View ‘man’ which is a let down. Overall, I am going to go with 8/10 for their great UI (thanks ESRI) and accessibility.
Marlborough Regional Council
A standard implementation of LocalMaps. The fade effect is less annoying here as it seems to go on for less time. Data for each section is relevant, and often contains lots of datasets to make up a section. For example, the Walking and Cycling LocalMaps link loads up layers of DoC huts, contours, roads and so on. I like this idea, although still think it could be achieved really easily with a single dashboard with tagged datasets.
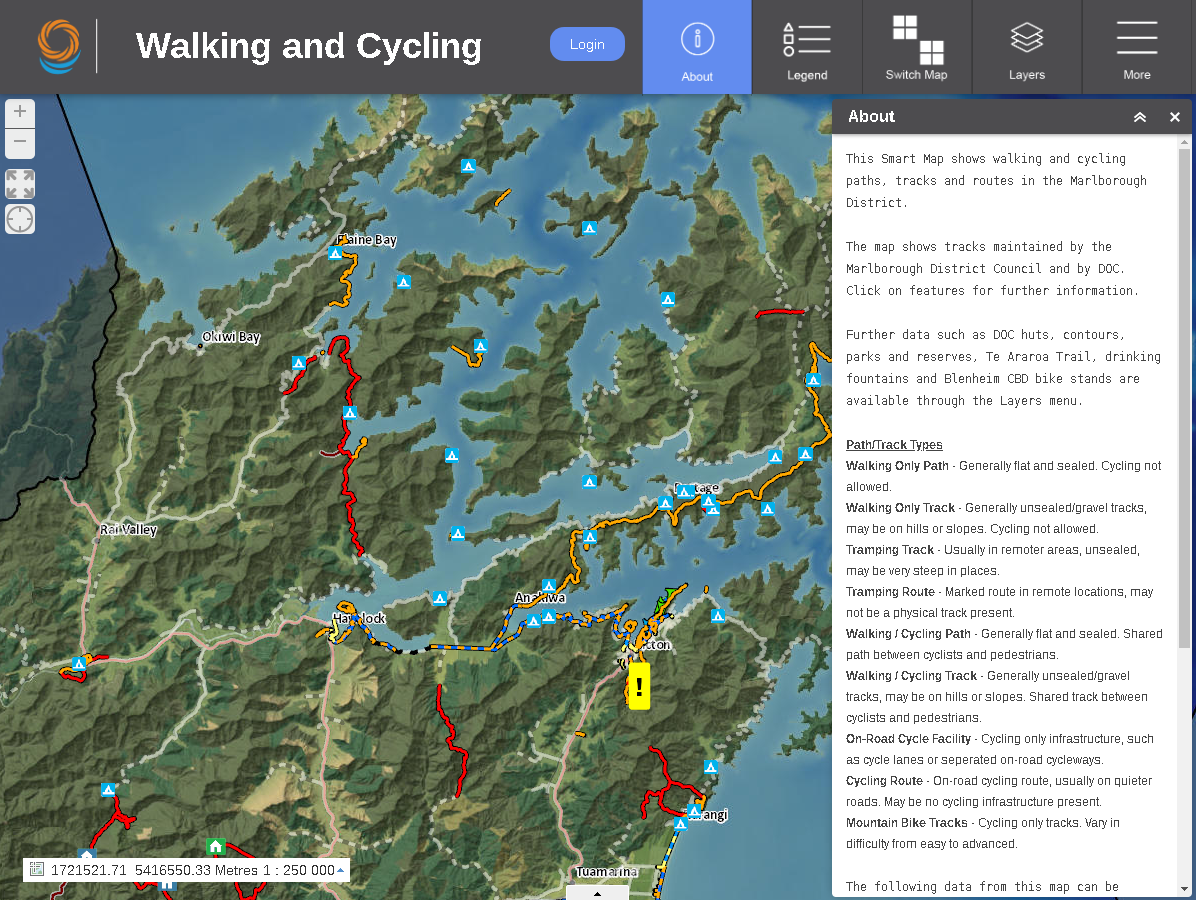
The last thing I want to note is on the Walking and Cycling LocalMaps there is a link to report a cycling crash/near miss, including a webmap to show where it is and boxes to enter license info etc. This is such a cool idea, and I will have to look if other councils have it. 6/10.
West Coast Regional Council
LocalMaps, my old friend. I wonder if they are all under the same contract. For a series of apparently independent regional councils they all seem to really like LocalMaps. This implementation is fast and with good data. But wait, here is where it gets interesting. When I click on some links I get to a GeoCortex dialogue. Maybe LocalMaps is a data hosting system and GeoCortex handles the webmapping of spatial data? From what I can see, LocalMaps is something that Eagle Technology (NZ’s ESRI reseller) has designed so I presume they are selling it to councils along with other ESRI tech underneath such as GeoCortex.
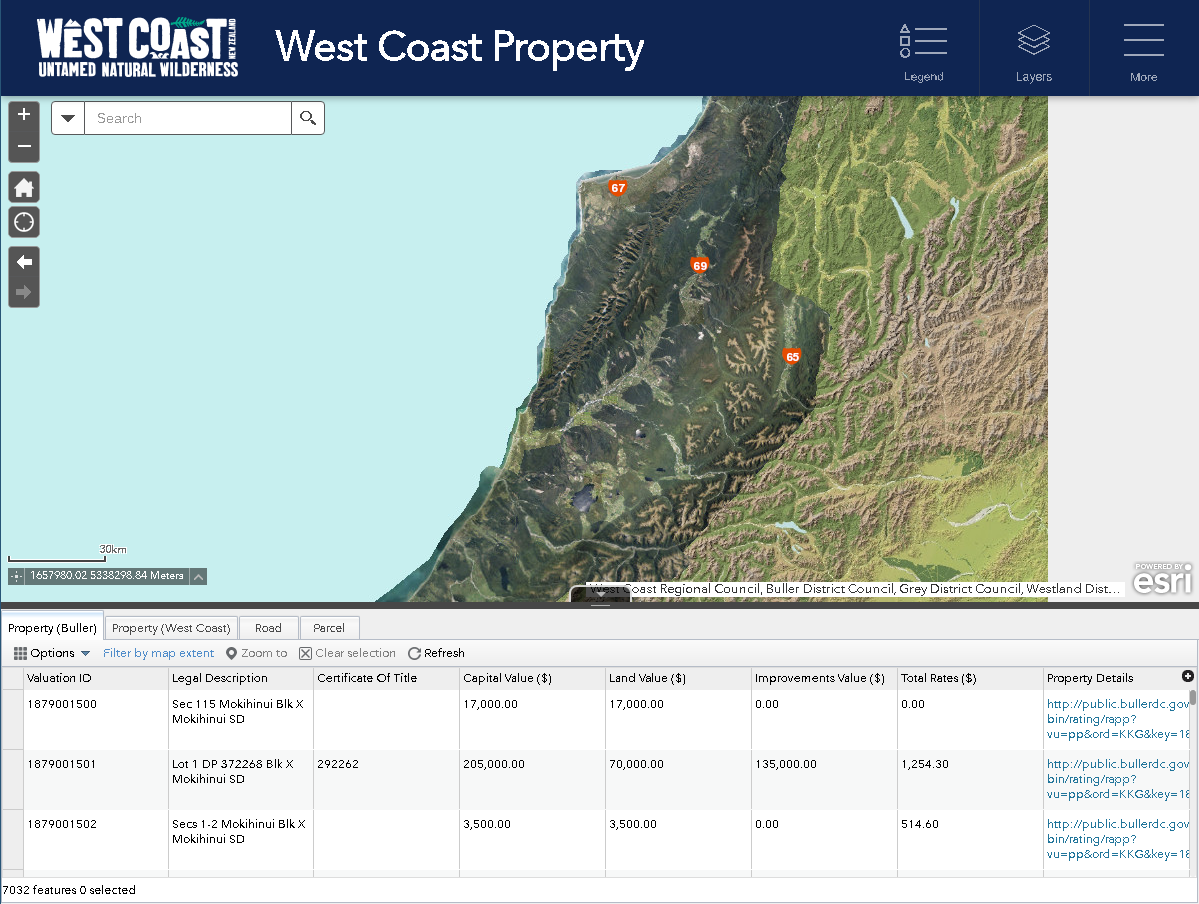
Anyway, this viewer is about as boring as all of the other LocalMaps, but with some cool data (I like Water Services). 5/10
Canterbury Regional/District(s) Council
I am going to call this an ArcGIS Dashboard is it has a better UI than most of the LocalMaps. I like the Swipe feature (kind of surprising most do not have this), lots of tools are at the user’s disposal, and there are a fair few good datasets to peruse.
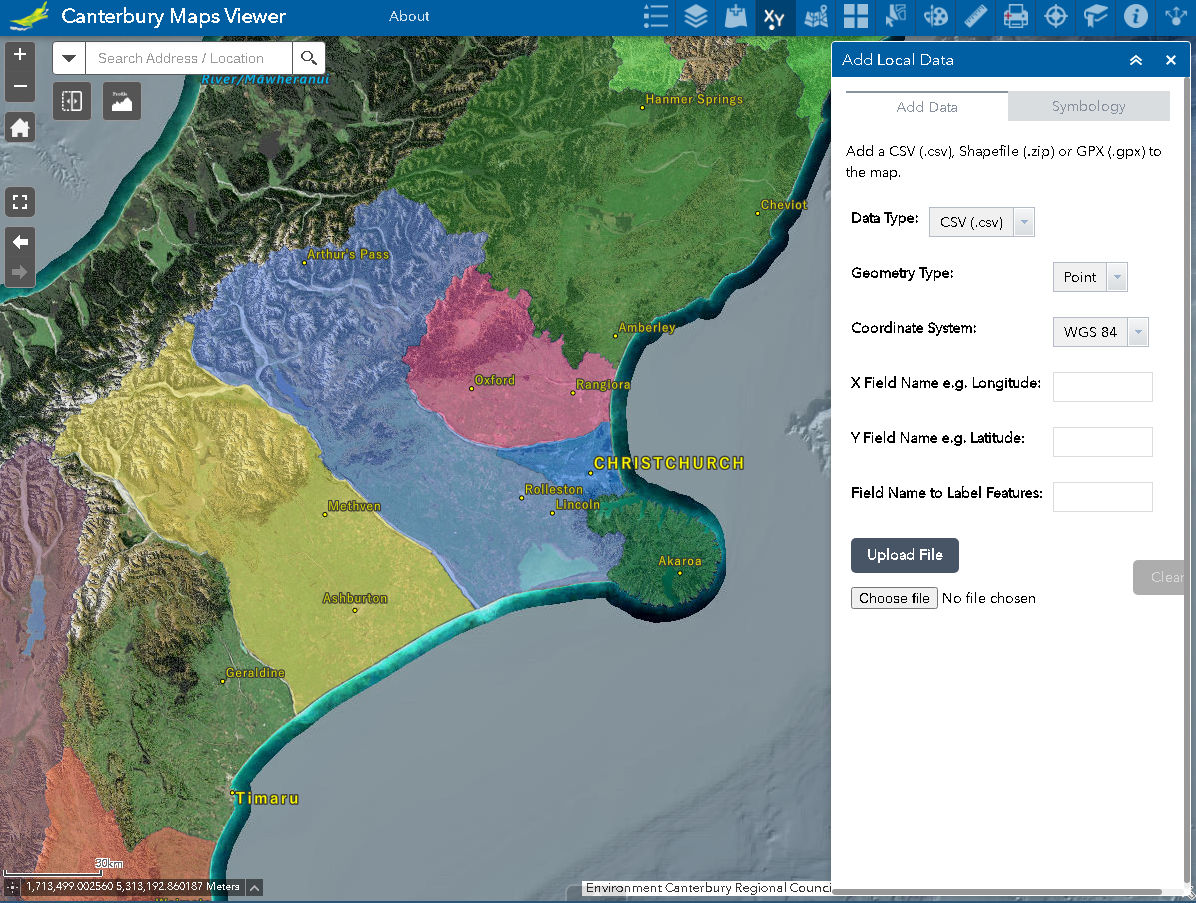
Panning the map can be a bit laggy, but overall I still think it is quite a usable system. I know I really should stop banging on about the fade effect, but it really grinds my gears and feels super unprofessional. I do like the Share function where you can embed the webmap into your site easily. Overall, a few quality-of-life improvements on LocalMaps are seen but they still end with a 6/10.
Otago Regional Council
Another LocalMaps gallery. very few datasets, no difference otherwise to other LocalMaps systems.
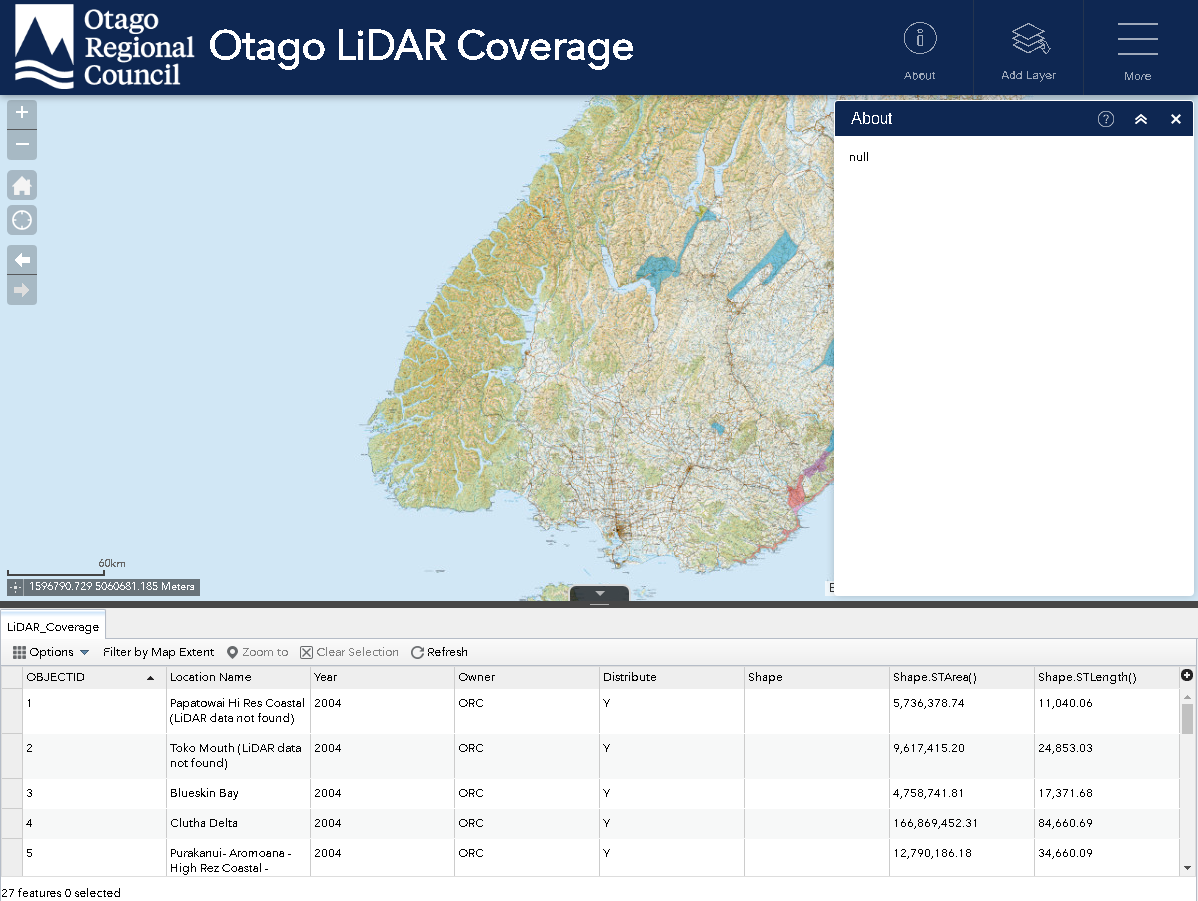
The About section reads ‘null’ again, which always makes me laugh and at least a third of these viewers have suffered from it or some other basic error that could be fixed in a few minutes. 3/10.
Southland District Council
And we have made it to the end, our final GIS viewer. This one is special, and I really want to like it after seeing the Leaflet attribution at the bottom left of the screen. The UI focuses on the map which I always appreciate. Not being able to double-click to zoom in is frustrating, and screams of a basic event handling fix to me. Tools and layers are about as basic as it gets. Some of the data layers just don’t work, such as aerials (a major one).
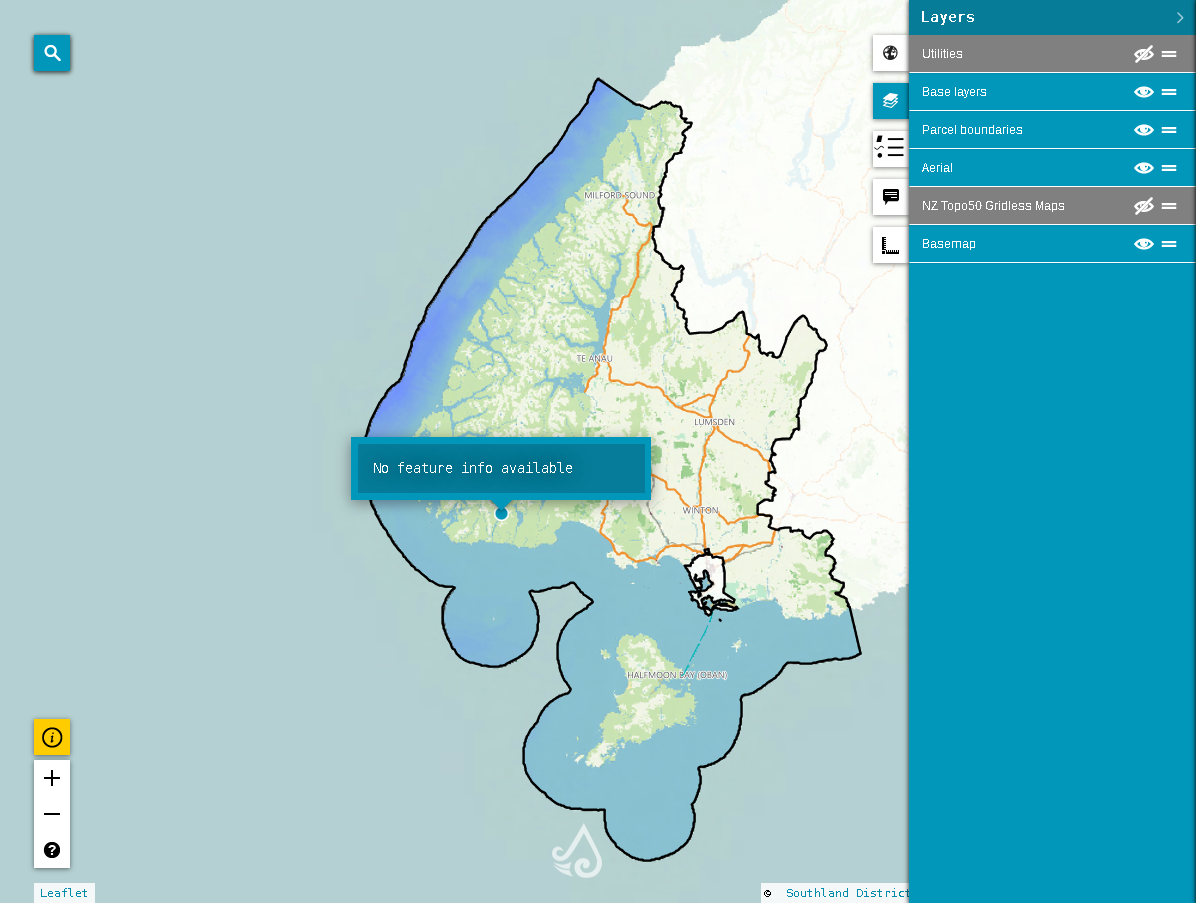
Again, I really, really want to love it since it uses open-source tools which I am so familiar with. But so many issues seriously hold it back. I still love the UI, and how clean the whole thing is, so despite these massive fallbacks I am going to go with 6/10.
Summary and Final Thoughts
Most of these GIS viewers were pretty much the same. None appeared to be developed internally, with the vast majority likely contracted to Eagle. I am sure this makes much more sense than developing something bespoke and for the most part they are effective at delivering geospatial data to the general public. GeoMaps was a clear favourite for me, with its intuitive and snappy UI with a plethora of data sources amalgamated into one great GISystem.
A lot of the issues I had with viewers were not down to the supplier, but to do with the way that councils are implementing their toolkits. I assume that each council has at least one GIS person who interacts with the contractor that provides the GISystem (Eagle, I guess), and basic things like not adding an About section and other ‘null’ values sprinkled around the place really leave a sour taste in my mouth when evaluating these systems.
All of this begs the question: why do we need different GIS viewers for different councils? Why can we not contain all GIS data within a central data management system, or at the very least link all of the data from a single dashboard? Is it a question of data sovereignty, or simply the cogs of the Government turning at a slow pace with lack of communication/collaboration? Who knows. I understand that the people targeted by these viewers are residents within each district/region so it might be a bit overwhelming to show them an entire country’s worth of data, but this can be handled with some good UX design.
I am simply a judgemental student who has never had a real job, so I know not of the hurdles that have been jumped through to develop and deploy these systems. It was really fun to go through them and learn about the way these organizations choose to present their spatial data. It seems like NZ is a great place for accessing open data and these viewers are a cool way of doing this. Nevertheless, I hope you enjoyed reading. Have a nice day.
*Updates
After I posted this report to the NZ GIS Geeks Facebook page I got a massive response. Thanks to Google Analytics (I recommend using uBlock) I could see that I got around 150 unique visitors from 4 countries, which was really cool. I got some strongly written comments, both for and against my statements. What was most scary was an email from the author of LocalMaps, but it turned out to be a really informative and amicable comment on the history of the service and how they have developed it and dealt with some of the issues I brought up. The main thing to clear up is that GeoCortex and LocalMaps are completely independent, so sorry about that leap. Thanks so much for all of the responses and constructive criticism, although I still am sticking to my opinions and judgements casted here!