Working with the GeoLife Dataset (PostGIS and Python)
I chose to work on human mobility for my GIS programming course’s final project. I was pointed to the GeoLife dataset, a massive set of GPS trajectories collected by Microsoft Asia. This dataset contains a bit over 24 million rows of data, so was sold to me as a pretty interesting challenge.
And so, much to my Python interpreter’s dismay, I saved the entire dataset as a GeoPandas dataframe. The .to_postgis() function of GeoPandas does not work on such a massive dataset, or at least made me feel incompetent with 16GB of RAM. I had to iterate through the dataframe and INSERT INTO each row, which took over 13 hours. This had the positive side effect of letting me code in a progress bar, which made me really hate how black-box SQL is when it comes to debugging and showing progress of large queries…
But I digress, eventually I got the entire dataset into a local PostGIS server and was ready to play with it.

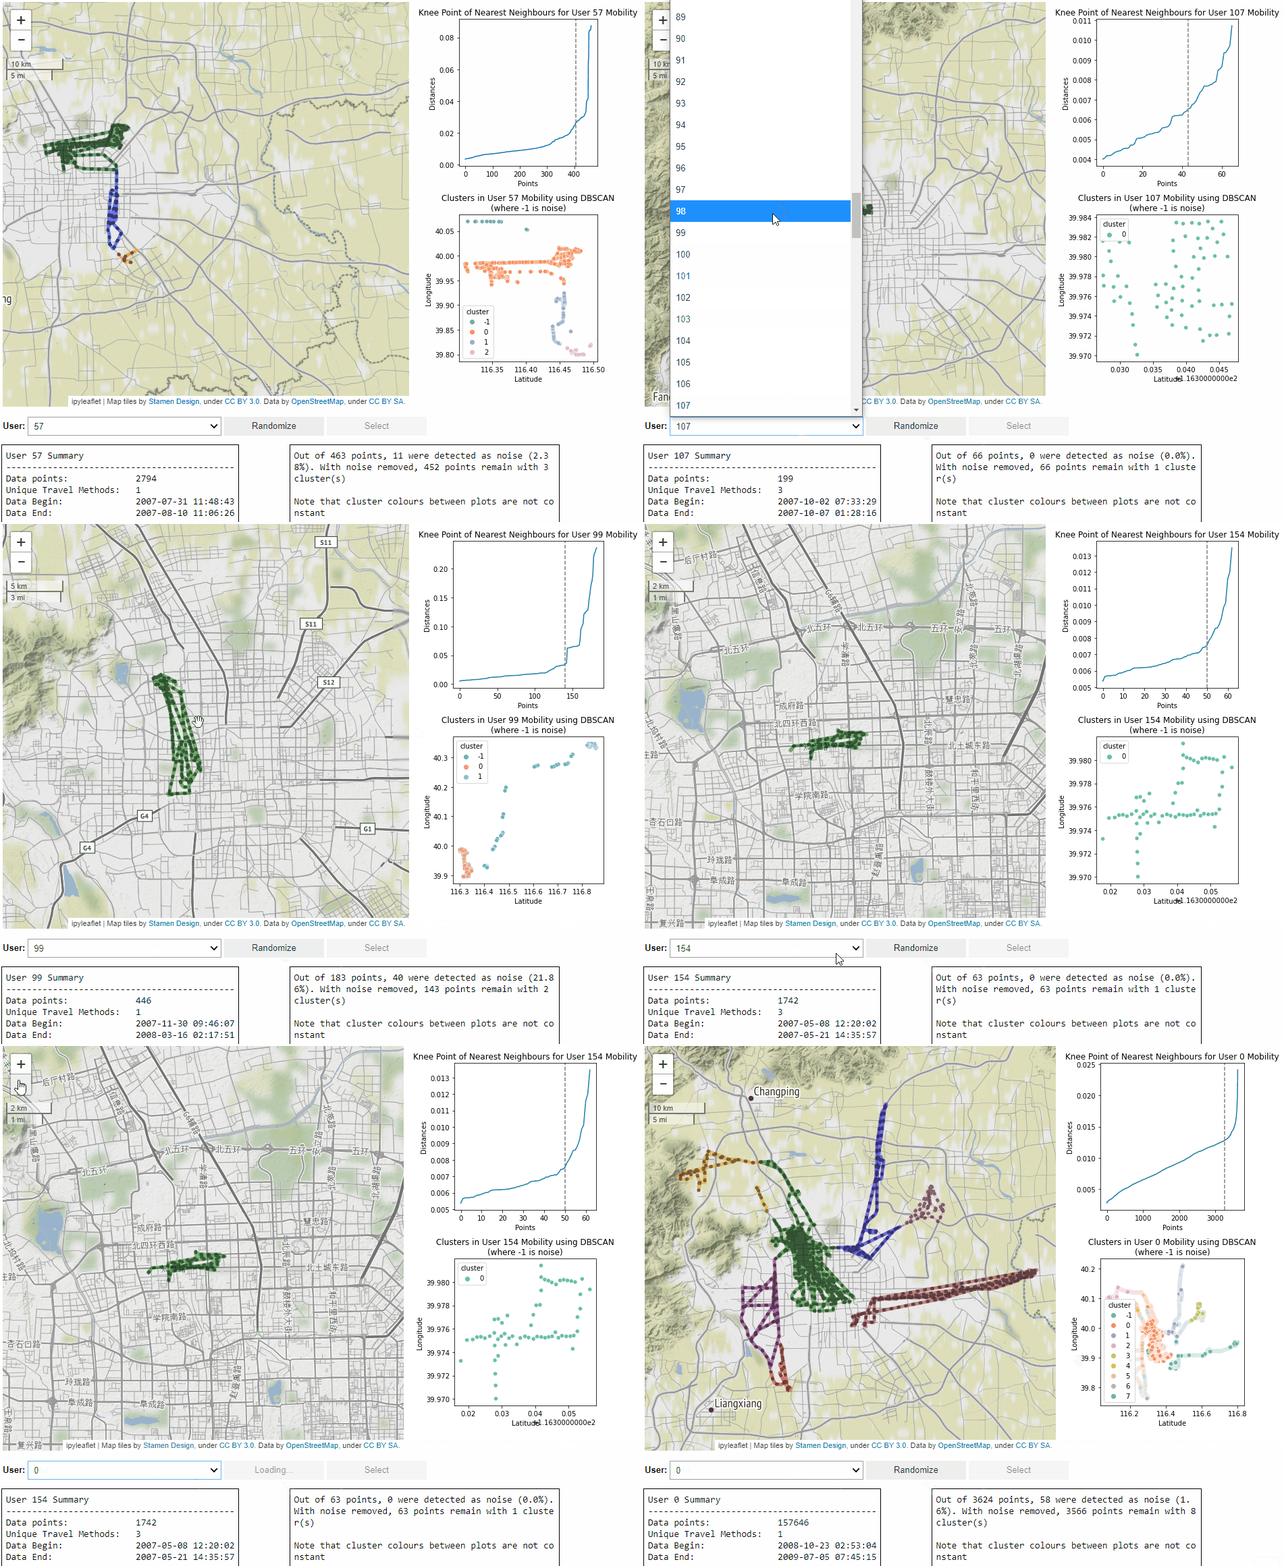
I ended up making what I will loosely define as a ‘dashboard’ for looking through user-level data. The code lets you select any user based on their identifier then runs a DBSCAN clustering algorithm on their GPS trajectories. It displays their movements, coloured by cluster and scrubbed of noise, on a folium map. This map is surrounded by the plots outlining the clustering, with some debugging and user information along the bottom.
I learnt a huge amount completing this project. If you would like to know more, the code is publicly available (MIT) on my GitHub. The main thing I took away from this endeavour is that open-source alternatives to ArcGIS Dashboard kind of suck. There is certainly an opportunity for the development of an open-source GIS dashboard platform - even if it just makes it easier to combine plotting tools (ie. matplotlib) with mapping tools (ie. matplotlib, folium).
Cheers, have a good day.